PaperBanana
PaperBanana is an AI tool that generates precise methodology diagrams and statistical charts from text descriptions, ensuring high-quality academic illustrations.
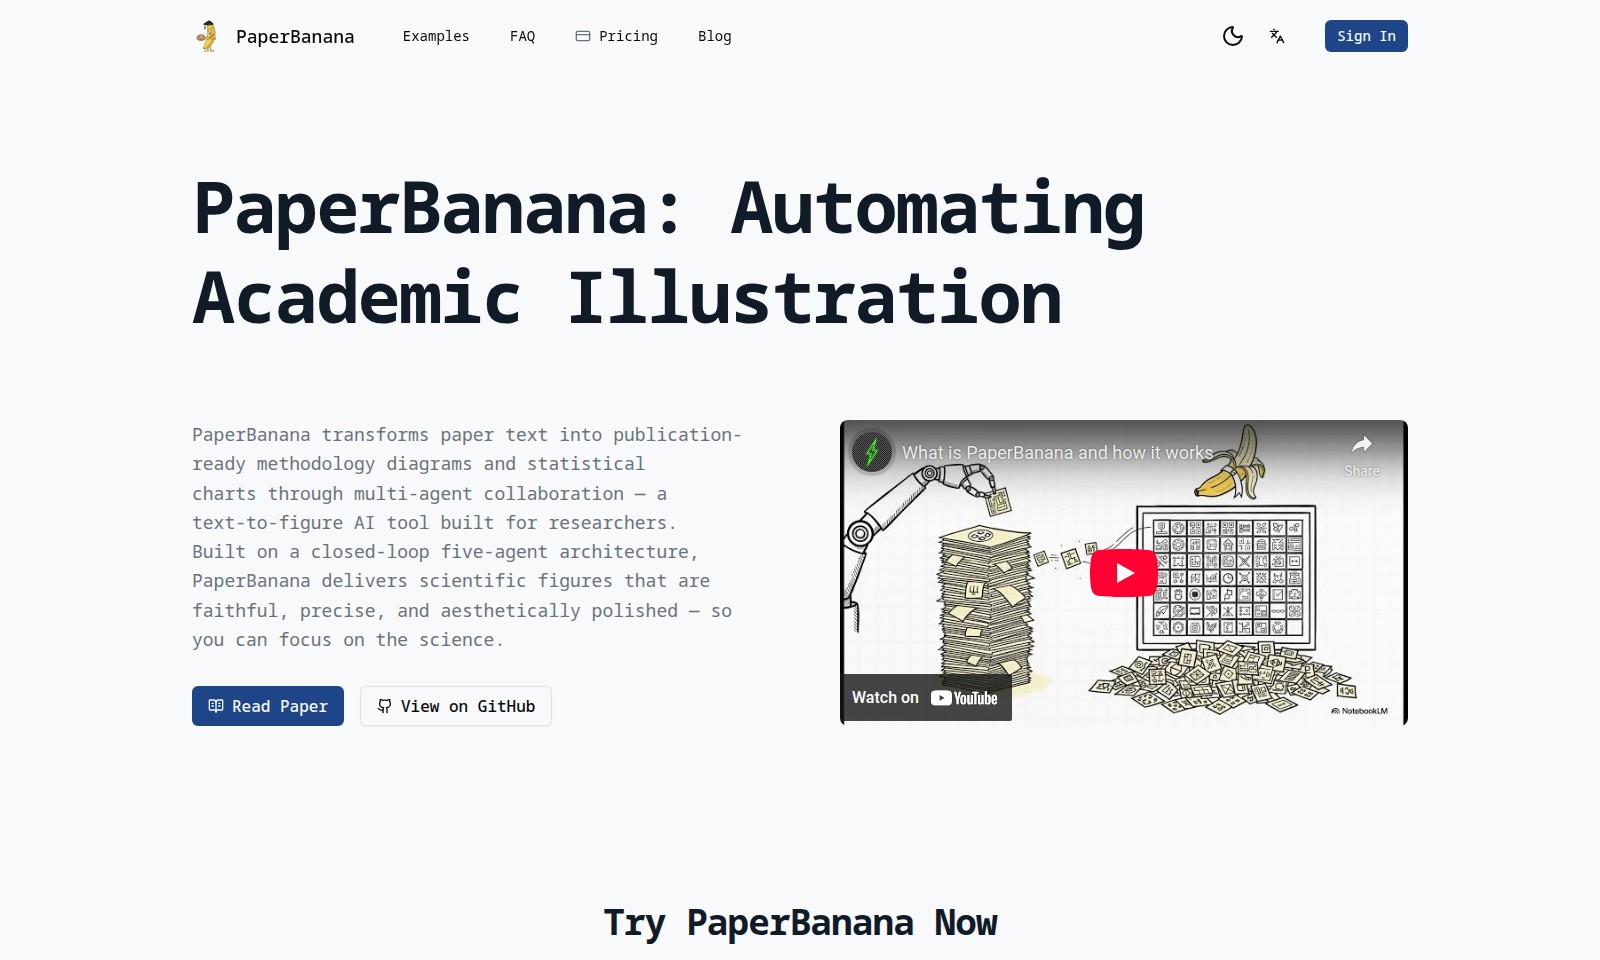
PaperBanana Introduction
PaperBanana: Automating Academic Illustration
PaperBanana is an innovative tool designed specifically for researchers, transforming traditional paper text into publication-ready diagrams and statistical charts through the power of multi-agent collaboration. This advanced text-to-figure AI tool streamlines the process of creating accurate and aesthetically appealing scientific visuals, allowing you to concentrate on your research without worrying about the intricacies of illustration.
PaperBanana Features
Automated Figure Generation - Effortless Data Visualization
With PaperBanana, researchers can generate academic illustrations effortlessly, saving time and resources. This tool employs advanced AI algorithms to transform simple text descriptions into comprehensive visual representations, enabling quick turnaround for publication-quality figures.
Multi-Agent Collaboration - Enhanced Accuracy and Design
Utilizing a closed-loop five-agent architecture, PaperBanana ensures that each figure is not only precise but also visually appealing. This collaborative approach allows for continuous refinement and validation of figures, resulting in high-fidelity outputs that align with publication standards.
Natural Language Processing - User-Friendly Input
Competitors may require complex software skills, but with PaperBanana, simply describe your figure in plain English and watch as the AI interprets your request. This feature significantly lowers the barrier for researchers unfamiliar with graphic design tools, making academic publishing accessible to a wider audience.
Diverse Output Options - Flexibility Across Disciplines
Whether it’s methodology diagrams, statistical charts, or flow charts, PaperBanana caters to various academic fields with diverse visualization needs. Users can choose from an array of visual styles, ensuring that the final product meets both scientific accuracy and aesthetic preferences.
Real-Time Previewing - Immediate Feedback
Gain instant insights into your generated figures with the real-time preview feature. This functionality allows users to make adjustments on-the-fly, streamlining the revision process and accommodating last-minute changes before submission.
Cross-Platform Compatibility - Work Anywhere
PaperBanana is designed to work seamlessly across various devices and operating systems, ensuring that you can create figures whether you're in the lab, office, or at home. This feature provides ultimate flexibility for researchers who may need to work in different environments.
Continuous Improvement - Adaptive Learning
Leverage PaperBanana's adaptive learning features, where the system continually improves its output based on user feedback and evolving design trends. This ensures that as a user, you benefit from ongoing enhancements without needing to keep up with complex updates.
Frequently Asked Questions About PaperBanana
What is PaperBanana?
PaperBanana is an innovative tool that automates the creation of academic illustrations from written text. Designed for researchers, it converts paper text into publication-ready methodology diagrams and statistical charts through advanced AI technology.
How does PaperBanana work?
PaperBanana operates on a unique five-agent architecture that collaborates in a closed-loop system. This allows the tool to generate figures that are not only accurate but also visually appealing, ensuring that researchers can present their work effectively without getting bogged down in figure creation.
What types of figures can I create with PaperBanana?
You can create a variety of figures using PaperBanana, including methodology diagrams, statistical charts, system architectures, flow charts, and poster assets. Simply input a text description of your desired figure, choose a visual style, and let the AI handle the rest.
Is PaperBanana easy to use?
Absolutely! PaperBanana is designed with user-friendliness in mind. You just need to describe the figure you want in natural language, select your preferred style, and the tool will generate a professional-quality illustration in seconds.
Can I try PaperBanana for free?
Yes, you can experience PaperBanana's capabilities firsthand by trying it out for free. Visit the website to input your text description and see how quickly the tool can produce a high-quality academic illustration.
Where can I find more resources on using PaperBanana?
For more information, you can check out the FAQs on the website, explore the blog for tips and tricks, or view the source code on GitHub. These resources will help you maximize your experience with PaperBanana.
How to Use PaperBanana
Step 1: Register an Account
To get started, click on the 'Sign In' button at the top of the homepage. Select 'Register' to create a new account. Fill in the required fields including your email address and create a secure password.
Step 2: Verify Your Email
Check your inbox for a verification email from PaperBanana. Click on the link provided to verify your email address. This step is crucial to ensure the security of your account.
Step 3: Set Up Your Profile
Log in to your newly created account and navigate to your profile settings. Here, you can add details like your name, institution, and area of research to personalize your experience.
Step 4: Start a New Project
Once your profile is set up, click on the 'New Project' button on your dashboard. This will lead you to a page where you can input text descriptions of the figures you want to generate.
Step 5: Enter Descriptions and Choose Style
In the project interface, type a clear description of your desired methodology diagram or statistical chart. Use the dropdown menu to select a visual style that fits your project needs.
Reviews
Pros
- Easy to use
- Fast processing
- Great results
- Affordable pricing
Cons
- Limited free version
- Requires internet connection
Comments
No comments yet. Be the first to share your thoughts!